Guide
What Makes an Indicator Actually Useful? A Practical Guide for Better MEAL
A practical guide to designing MEAL indicators that measure meaningful progress, produce credible evidence and help programme teams make better decisions.
Mizan Evidence
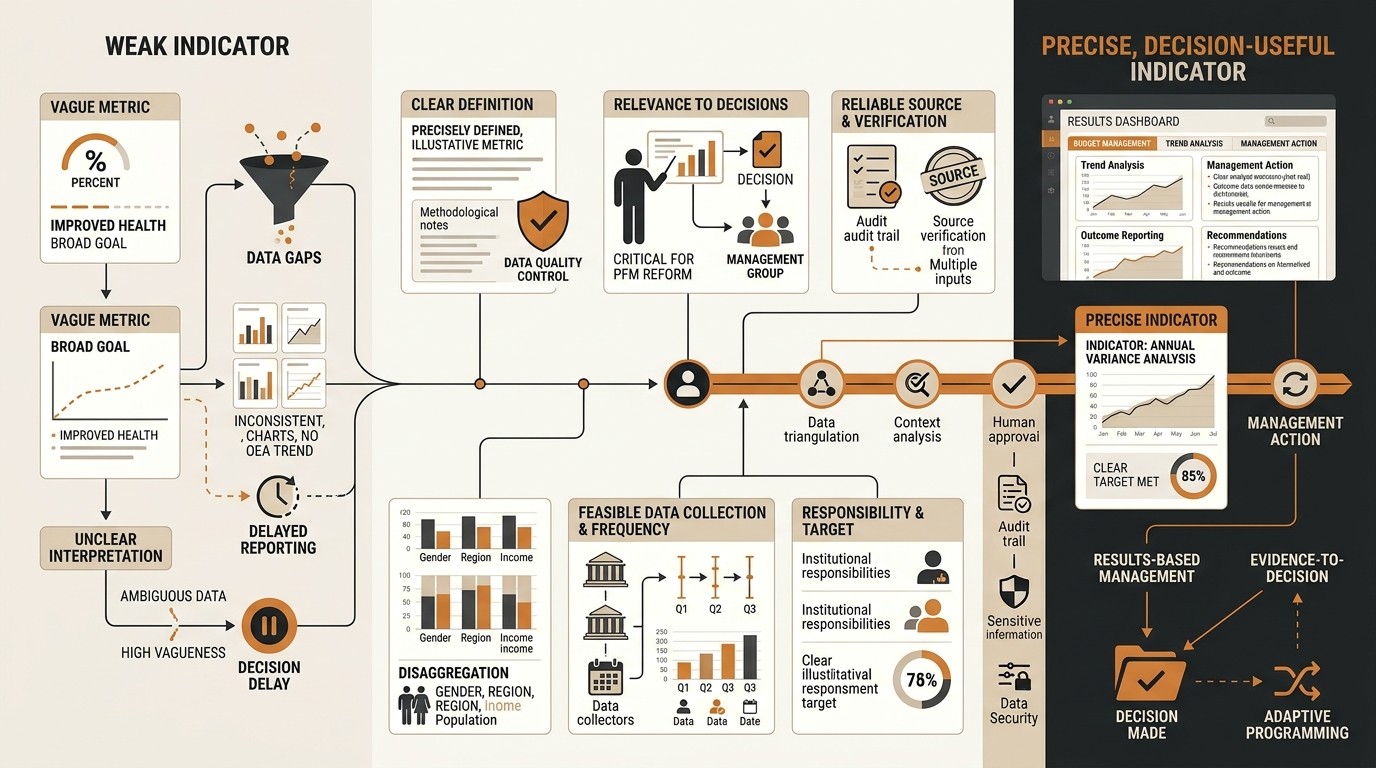
What Makes an Indicator Actually Useful? A Practical Guide for Better MEAL
Indicators are everywhere in international development.
They appear in logframes, results frameworks, monitoring plans, donor reports, dashboards, evaluations and programme reviews.
They tell us how many people were reached, what percentage completed an activity, whether services improved, whether behaviours changed and whether programmes appear to be progressing toward their intended results.
But an indicator can be perfectly measurable and still be practically useless.
It can be SMART.
It can have a baseline.
It can have a target.
It can appear beautifully on a dashboard.
And it can still tell decision-makers very little about whether the programme is achieving meaningful change.
That is why one of the most important questions in MEAL is not:
Can we measure this indicator?
It is:
If we measure this indicator well, what will we actually understand that we do not understand now?
That question changes indicator design.
It moves the conversation away from simply filling cells in a logframe and toward building a measurement system that helps programmes understand performance, identify problems, learn and make decisions.
This guide explains how to do that.
What Is an Indicator?
An indicator is a measure used to help us understand whether a condition exists, whether something has changed or whether progress is being made toward an expected result.
It is a signal.
It is not the result itself.
This distinction matters.
Suppose a programme aims to improve women's economic resilience.
The programme may use indicators relating to:
income;
savings;
business continuity;
control over financial decisions;
access to markets;
use of financial services;
diversification of income sources.
Each indicator captures part of the picture.
None automatically represents the entire concept of economic resilience.
Indicators simplify reality so that organisations can observe change systematically.
Good indicators simplify reality usefully.
Poor indicators simplify reality in ways that can create false confidence.
Start With the Result, Not the Indicator
A common indicator-design mistake is starting with:
What can we easily count?
The better starting point is:
What change are we trying to understand?
Consider a youth employment programme.
Someone proposes:
Number of young people completing employability training
This is measurable.
It may also be important.
But what does it tell us?
It tells us that participants completed training.
If the intended result is:
Young people improve their employability and transition into decent employment
then training completion captures only one part of the pathway.
A simplified results chain might look like this:
Training delivered
↓
Young people participate
↓
Participants acquire relevant competencies
↓
Participants apply those competencies
↓
Employment prospects improve
↓
Participants obtain or improve employment
Different indicators are useful at different levels.
For example:
Activity
Number of employability training sessions delivered.
Output
Number and percentage of enrolled participants completing the training package.
Immediate outcome
Percentage of participants demonstrating improved competency in targeted skills.
Intermediate outcome
Percentage of participants applying targeted job-search or workplace competencies three months after training.
Higher-level outcome
Percentage of eligible participants entering employment, self-employment or improved employment within six months.
None of these indicators is inherently superior to the others.
They answer different questions.
The mistake occurs when we use an indicator from one level to make a claim about another.
Training 2,000 people demonstrates that 2,000 people were trained. It does not, by itself, demonstrate improved employment.
Outputs Matter, but They Are Not Outcomes
MEAL professionals sometimes criticise output indicators so strongly that programme teams begin thinking outputs are unimportant.
That is a mistake.
Programme managers absolutely need to know whether planned activities and outputs are being delivered.
If your programme planned to train 500 health workers and only 120 participated, that is important management information.
You should not wait for an outcome evaluation to discover that implementation failed.
Output indicators can provide important early warning signals.
The problem is not measuring outputs.
The problem is confusing outputs with results farther along the causal pathway.
A balanced MEAL system should help answer several different questions:
Did we deliver what we planned?
Did the intended people access it?
Was the quality acceptable?
Did participants acquire something from it?
Did behaviour, practice or conditions change?
Did change differ between groups?
Is the change likely to continue?
No single indicator usually answers all of those questions.
That is why indicator design should begin with the programme's results logic.
SMART Is Useful, but It Is Not Enough
Most development professionals know the SMART test.
Indicators are commonly expected to be:
Specific
Measurable
Achievable or Attainable
Relevant
Time-bound or Timely
SMART is useful.
But it should be treated as a first screen rather than a complete indicator-quality framework.
Consider this indicator:
Number of community meetings conducted by December 2027
It is specific.
It is measurable.
It is attainable.
It may be relevant.
It is time-bound.
It is SMART.
But if the programme's intended result is:
Increased trust between communities and local government
the indicator does not tell us whether trust improved.
A SMART indicator can therefore still be poorly aligned with the result it is supposed to measure.
For professional indicator design, we need to go further.
The Nine Tests of a Useful MEAL Indicator
A useful indicator should survive more than a SMART test.
At Mizan Evidence, we recommend examining at least nine dimensions:
Relevance
Validity
Reliability
Sensitivity
Feasibility
Clarity
Disaggregation
Actionability
Behavioural consequences
Let us examine each one.
Test 1: Relevance
The first question is simple:
Does this indicator actually relate closely to the result we care about?
Consider this result:
Women participating in the programme have increased influence over household financial decisions.
Proposed indicator:
Number of women attending financial-literacy training.
Attendance may be relevant to programme delivery.
But it does not measure women's influence over household financial decisions.
A more relevant indicator might examine the proportion of participants reporting meaningful involvement in clearly defined household financial decisions.
That indicator would need careful design, particularly because decision-making power is complex and sensitive.
But conceptually it is much closer to the intended result.
Ask this question
If this indicator improves, can we reasonably say that the result it represents is also improving?
If the answer is clearly no, reconsider the indicator.
Test 2: Validity
Validity asks:
Are we actually measuring what we claim to be measuring?
Suppose a governance programme wants to measure:
Community trust in local institutions
and uses:
Number of community-government meetings conducted
as the indicator.
More meetings may create opportunities for engagement.
But meetings do not automatically indicate trust.
Trust could increase.
Trust could remain unchanged.
Trust could even decline after poorly managed meetings.
The indicator therefore has weak validity as a measure of trust.
A carefully designed perception measure might be more valid.
For example:
Percentage of surveyed community members expressing confidence that the municipal authority will respond fairly to a service complaint
Even then, the indicator would measure a specific dimension of institutional confidence rather than every aspect of trust.
Validity requires conceptual honesty
Ask:
What exactly does this measure?
Then ask:
Are we claiming more than the measure can support?
That second question is especially important.
Many weak indicators are not useless because the underlying data are poor.
They become misleading because organisations interpret them too broadly.
Test 3: Reliability
Reliability asks whether measurement would produce reasonably consistent results when implemented properly.
Consider:
Number of vulnerable households receiving support
The indicator seems straightforward.
But what qualifies a household as vulnerable?
If there is no operational definition, one field officer may classify a household as vulnerable because it is female-headed.
Another may require multiple vulnerability criteria.
Another may make a subjective judgment.
The reported number then depends partly on who collected the data.
That is a reliability problem.
Improve reliability through definition
Instead of leaving "vulnerable" undefined, establish explicit eligibility or classification criteria appropriate to the programme.
For example:
A household qualifies under the programme's vulnerability classification when it meets at least two of the defined criteria listed in the programme protocol.
The specific criteria depend on programme context.
The principle is what matters.
Important concepts should not depend on individual interpretation when consistent measurement is required.
Test 4: Sensitivity to Change
A good indicator should be capable of detecting the type of change the programme could reasonably influence.
Imagine a six-month employment pilot working with 300 young people.
The programme chooses:
National youth unemployment rate
as its main performance indicator.
National unemployment is important contextual information.
But it is influenced by:
economic growth;
fiscal policy;
labour-market conditions;
migration;
private-sector investment;
political stability;
education systems;
inflation;
thousands of other employers and programmes.
A 300-person intervention is unlikely to produce a detectable change in the national unemployment rate.
The indicator may therefore be highly relevant to the broader development challenge but insensitive to programme performance.
A more useful programme-level measure might examine employment outcomes among the people actually reached.
Ask:
Could our intervention plausibly move this indicator within the timeframe and scale of the programme?
If not, it may belong in contextual monitoring rather than programme performance measurement.
Test 5: Feasibility
An indicator can be conceptually excellent and still be operationally inappropriate.
Imagine the ideal measure requires:
a representative household survey;
specialised enumerators;
longitudinal follow-up;
advanced statistical analysis;
and significant financial resources.
For a small project, collecting it every quarter may be unrealistic.
A useful indicator must therefore balance rigour and feasibility.
Consider:
How much will collection cost?
How much staff time will it require?
How much burden does it place on respondents?
Can the required population actually be reached?
Can the organisation maintain the method consistently?
How frequently is the information genuinely needed?
Sometimes a more modest but reliable measure is better than a sophisticated indicator that the programme cannot implement properly.
Measurement should be rigorous enough for the decision, not complicated for the sake of appearing rigorous.
Test 6: Clarity
Indicators should be understandable enough that another trained person can determine exactly how they are calculated.
Consider:
Percentage of supported MSMEs demonstrating improved business performance
This sounds professional.
It is also ambiguous.
What counts as supported?
What qualifies as an MSME?
What does improved performance mean?
Increased revenue?
Profit?
Employees?
Business survival?
Productivity?
Sales?
Market access?
Compared with what period?
How much improvement is required?
An indicator that sounds precise may still hide substantial ambiguity.
A stronger version
Depending on the programme objective, the indicator might become:
Percentage of supported micro and small enterprises reporting an increase of at least 10 percent in inflation-adjusted monthly net revenue six months after completing the business-support package
Now additional questions can be answered clearly.
Who qualifies?
What is being measured?
Compared with when?
At what point after the intervention?
What threshold counts as improvement?
The indicator is not automatically methodologically perfect.
But it is much more transparent.
Test 7: Disaggregation
A programme average can conceal very different experiences.
Imagine a programme reports:
82% participant satisfaction
That appears strong.
Now disaggregate the same data:
Men: 92%
Women: 70%
The overall number is still 82 percent.
But your understanding of programme performance changes dramatically.
Suppose you examine disability status:
Participants without disabilities: 86%
Participants with disabilities: 55%
Now the programme has an important equity question.
Disaggregation helps answer:
Who is benefiting?
Who is not?
Where are barriers concentrated?
Are programme results equitable?
Relevant disaggregation might include:
sex;
age;
disability;
location;
displacement status;
socioeconomic group;
programme modality;
partner;
cohort;
other contextually important characteristics.
But there is an important caution.
Do not collect demographic data automatically
Every additional variable creates:
respondent burden;
data-management requirements;
privacy responsibilities;
and potentially protection risks.
Only collect disaggregation information that is relevant, ethical and safe to use.
The purpose is not to build the largest beneficiary profile possible.
It is to understand meaningful differences in access, experience and outcomes.
Test 8: Actionability
This may be the most neglected indicator test.
Ask:
If this indicator turns red next month, what could we do differently?
Consider:
Percentage of referred cases accessing the designated service within the agreed referral timeframe
If performance declines, programme staff can investigate:
transport barriers;
referral delays;
service-provider capacity;
communication failures;
eligibility problems;
geographic access.
The indicator can trigger a management response.
Now consider:
Number of brochures printed
The number may be important for logistical management.
But by itself, it tells us very little about whether the communication strategy is working.
The stronger questions may be:
Were materials distributed?
Did the intended audience receive them?
Did they understand the information?
Did the information affect awareness or behaviour?
Not every indicator needs to trigger an operational decision.
Some exist for accountability or reporting.
But the overall framework should contain indicators that help people manage the programme, not merely describe it.
Test 9: Behavioural Consequences
Indicators do not simply measure behaviour.
They can change behaviour.
This deserves more attention.
Imagine a programme team is judged primarily by:
Number of participants trained
What behaviour might that encourage?
Possibly:
larger training groups;
shorter sessions;
rapid recruitment;
lower participation thresholds;
less attention to training quality.
Now imagine staff are judged entirely by:
Percentage of participants obtaining employment
What might happen?
Teams may have an incentive to recruit participants who are already closest to employment while excluding people who face greater barriers.
The indicator itself has changed programme behaviour.
Every performance measure creates incentives
Ask:
If staff try to maximise this number, what behaviour could follow?
Then ask:
Is that behaviour consistent with the programme's purpose and values?
This does not mean performance indicators should be abandoned.
It means they should be designed and interpreted carefully.
The Indicator Interpretation Test
Every indicator should answer two additional questions.
If the indicator improves, what can we legitimately conclude?
Suppose:
90% of participants complete the training programme
You can conclude:
Training completion among enrolled participants was high, assuming the underlying data are reliable and the denominator is correctly defined.
You cannot automatically conclude:
Participants learned.
Participants changed behaviour.
The training was high quality.
Participants obtained employment.
The programme achieved impact.
Those require additional evidence.
If the indicator deteriorates, what can we legitimately conclude?
Suppose completion falls from 90 percent to 65 percent.
You know that completion declined.
You do not yet know why.
Possible explanations could include:
programme quality;
transport barriers;
seasonal work;
security conditions;
changes in targeting;
schedule conflicts;
data-quality problems.
The indicator identifies a pattern.
Investigation identifies the explanation.
Indicators tell us where to look. They do not always tell us why something happened.
The Anatomy of a Strong Indicator
Consider this example:
Percentage of eligible participants who demonstrate correct use of at least four of five targeted financial-management practices six months after completing the business-support programme
What information do we need to make this operational?
Numerator
Number of assessed eligible participants demonstrating correct use of at least four of the five defined practices.
Denominator
Total number of eligible participants included in the valid follow-up assessment.
Population
Participants meeting the programme's eligibility and completion criteria.
Measurement point
Six months after programme completion.
Unit
Percentage.
Data source
Structured follow-up assessment.
Method
Defined assessment protocol using the five targeted practices.
Disaggregation
Potentially sex, age, disability, location or business type where relevant and appropriate.
Frequency
For example, each eligible participant cohort six months after completion.
Responsibility
Named team or role responsible for collection, calculation and review.
Limitations
Potential attrition at follow-up.
Possible self-report bias if practices are not independently observed.
External business conditions may influence ability to apply practices.
Management use
Determine whether participants are translating support into sustained business practices and identify groups or locations requiring further investigation.
Notice what has happened.
The indicator has moved from a sentence to a measurement protocol.
That is the difference between having an indicator and having an indicator that can be implemented consistently.
Percentage Indicators: Always Interrogate the Denominator
Percentages look precise.
They can also be misleading when the denominator is unclear.
Suppose an employment programme reports:
80% of participants found employment.
Eighty percent of whom?
Imagine:
160 people enrolled.
140 completed training.
120 responded to the follow-up survey.
96 respondents reported obtaining employment.
The programme could calculate:
96 ÷ 120 = 80% of follow-up respondents
or:
96 ÷ 140 = 69% of training completers
or:
96 ÷ 160 = 60% of enrolled participants
All three calculations are mathematically correct.
They answer different questions.
The denominator determines the meaning.
Always define:
Who is eligible for inclusion?
Who is excluded?
How are dropouts treated?
How are missing respondents treated?
Does the denominator remain consistent between periods?
Could attrition bias the result?
Whenever you see a percentage, train yourself to ask:
Percentage of what?
That single question catches many measurement problems.
Baselines: Change Compared With What?
Suppose a programme reports:
72% of participants demonstrate the targeted competency.
Is that good?
We do not know.
Perhaps the baseline was 30 percent.
That would suggest substantial improvement.
Perhaps the baseline was 75 percent.
Then performance may have declined.
A baseline creates a reference point.
It helps us understand where the programme started.
Baselines may come from:
pre-intervention surveys;
administrative data;
existing datasets;
retrospective evidence where appropriate;
previous programme data;
other credible sources.
Not every indicator requires a conventional baseline.
For some outputs, the starting value may logically be zero.
For others, baseline collection may be technically impossible or inappropriate.
The important principle is that change requires a meaningful reference point wherever one is needed.
Targets: Expected Performance, Not Fiction
Targets are often treated as promises.
That can create problems.
A useful target should represent an informed expectation of what the programme could reasonably achieve within a defined period.
Targets should consider:
baseline performance;
programme resources;
implementation capacity;
intervention intensity;
historical performance;
participant demand;
contextual constraints;
programme duration;
expected causal pathways.
A target should be ambitious enough to encourage performance but realistic enough to remain useful.
What happens when targets are arbitrary?
Suppose a programme has:
Baseline: 42%
End target: 90%
Why 90 percent?
If the answer is:
Because 90 looks ambitious
the target has limited analytical value.
A stronger target has a documented rationale.
For example:
Historical programmes achieved approximately 15 percentage points of improvement. The redesigned intervention provides greater implementation intensity, and the target assumes an improvement from 42 percent to 65 percent over two years.
Now performance can be interpreted against explicit assumptions.
Targets should support learning
If performance exceeds a target dramatically, ask why.
If performance falls significantly below target, investigate.
Sometimes implementation is weak.
Sometimes the target was unrealistic.
Sometimes the context changed.
Sometimes the indicator definition changed.
Targets should help teams understand performance, not punish them for reality.
Do Not Confuse Attribution With Measurement
Suppose an indicator shows:
Household income increased by 25 percent among participants.
Can the programme conclude:
Our intervention increased household income by 25 percent?
Not automatically.
The indicator tells us that income changed among the measured population.
It does not, by itself, establish why.
Income may also have been affected by:
economic conditions;
seasonality;
inflation;
migration;
other programmes;
market changes;
household composition;
government policy;
external assistance.
The more causal the claim, the stronger the evaluation design required.
This is an important distinction:
Indicators measure change. Evaluation design helps determine what caused that change.
Monitoring indicators can provide valuable evidence of progress without independently establishing attribution.
Quantitative Indicators Cannot Carry the Entire Evidence Burden
Some important development concepts are difficult to reduce to a single number.
Consider:
Empowerment
Trust
Institutional capacity
Social cohesion
Resilience
Meaningful participation
Quality of inclusion
Quantitative indicators can help measure dimensions of these concepts.
But they may not explain the experience behind the number.
Suppose:
72% of participants report increased confidence engaging with local authorities.
Useful.
Now qualitative inquiry can ask:
What does increased confidence look like in practice?
Why did confidence improve?
Did confidence lead to actual engagement?
Why did the remaining participants not experience the same change?
Were some groups more comfortable speaking than others?
Quantitative and qualitative evidence do not compete.
They answer different questions.
Strong MEAL systems use both when appropriate.
Proxy Indicators: Useful but Dangerous When Misunderstood
Sometimes the exact result we care about is difficult to measure directly.
A programme may then use a proxy indicator.
A proxy is a measure that indirectly represents another concept.
For example, school attendance may sometimes be used as one signal related to educational participation.
But attendance does not automatically demonstrate learning.
Service uptake may indicate access.
It does not necessarily demonstrate service quality.
Meeting attendance may indicate participation.
It does not necessarily demonstrate influence.
When using a proxy, document the logic
Ask:
Why do we believe this proxy relates to the underlying result?
What assumptions connect them?
What could cause the proxy to change without the result changing?
What other evidence could complement it?
Proxy indicators become dangerous when organisations forget they are proxies.
Composite Indicators: Useful Only When the Construction Makes Sense
Sometimes organisations combine several measures into a single index or score.
For example:
Household Resilience Score
or
Institutional Capacity Index
Composite indicators can simplify complex information.
But simplicity comes with methodological responsibilities.
You need to know:
Which dimensions are included?
Why were they selected?
How are they scored?
Are all dimensions weighted equally?
If not, why?
How are missing values handled?
Can improvements in one dimension compensate for deterioration in another?
Is the resulting score understandable?
A sophisticated-looking index is not automatically a better measure.
If nobody can explain how a score of 67 was produced, its usefulness is questionable.
Avoid Indicator Overload
One of the most common MEAL problems is not too little information.
It is too much information with too little analysis.
Imagine a programme tracks 65 indicators.
Each requires:
collection;
cleaning;
verification;
analysis;
reporting;
management.
Now ask:
How many are actually discussed during programme reviews?
How many influence decisions?
How many appear only because they have always been there?
Indicator frameworks have opportunity costs
Every unnecessary indicator consumes resources that could have been used to:
improve data quality;
conduct qualitative inquiry;
analyse important outcomes;
engage communities;
investigate unexpected findings;
or strengthen learning.
A useful indicator framework is therefore not necessarily a large framework.
It is a purposeful framework.
Before adding another indicator, ask:
What question will this help us answer that our existing evidence cannot?
If there is no clear answer, reconsider whether it is needed.
The Indicator Reference Sheet
Every priority indicator should have a documented reference definition.
The exact format can vary between organisations, but a practical Indicator Reference Sheet should include:
Indicator name
Exact approved wording.
Result statement
Which result the indicator relates to.
Result level
Activity, output, outcome, impact or contextual indicator.
Purpose
Why the organisation collects it.
Definition
Precise operational meaning.
Numerator
For percentages or ratios.
Denominator
For percentages or ratios.
Unit of measure
Number, percentage, ratio, score, rate or other unit.
Data source
Where the information originates.
Collection method
How the data are generated.
Frequency
How often measurement occurs.
Responsible person or team
Who collects, calculates, verifies and reviews it.
Disaggregation
Which categories should be reported.
Baseline
Starting value where relevant.
Target
Expected value where relevant.
Known limitations
What the measure cannot tell us.
Data-quality checks
How accuracy and consistency will be assessed.
Management use
What decision or management question the indicator supports.
That final field is particularly useful.
Management use.
It forces the organisation to explain why it is paying to collect the information.
A Practical Indicator Review Scorecard
Before approving an important indicator, score it against these questions.
Result alignment
Does it genuinely relate to the intended result?
Validity
Does it measure what we claim it measures?
Reliability
Could trained people measure it consistently?
Sensitivity
Could it detect the type of change the programme expects?
Feasibility
Can we collect it reliably with available resources?
Clarity
Are the important concepts and calculations defined?
Disaggregation
Can it reveal meaningful differences between relevant groups?
Actionability
Could the result influence a decision or trigger investigation?
Incentives
Could the indicator encourage unintended behaviour?
Interpretability
Can we clearly explain what an increase or decrease means?
If several answers are weak, do not simply improve the wording.
Reconsider whether the indicator itself is appropriate.
Turning a Weak Indicator Into a Useful Measurement Set
Consider this programme objective:
Improve women's economic resilience through microenterprise support.
Initial indicator:
Number of women trained
This tells us something about delivery.
But very little about economic resilience.
Instead of trying to force one indicator to measure everything, build a small measurement set across the causal pathway.
Output
Percentage of enrolled participants completing the defined business-support package
This tells us about programme reach and completion.
Quality
Percentage of participants rating the coaching as relevant to their priority business needs
This provides one perspective on perceived service relevance.
Immediate outcome
Percentage of participants demonstrating improvement in targeted business-management competencies after completing the programme
This examines capability.
Behavioural outcome
Percentage of participants applying at least three targeted business-management practices three months after programme completion
This examines application.
Business outcome
Percentage of supported businesses maintaining or increasing inflation-adjusted monthly net income six months after programme completion
This examines business-level change.
Equity analysis
Disaggregate appropriate outcome measures by relevant participant characteristics.
Qualitative learning question
What factors explain why some participants successfully apply the targeted practices while others do not?
Now the programme can diagnose where the pathway is working or breaking.
If completion is low, investigate access or delivery.
If completion is high but competency improvement is weak, examine programme quality.
If competencies improve but practices are not applied, investigate implementation barriers.
If practices improve but business outcomes remain weak, revisit assumptions about markets, capital, demand or the wider economic environment.
This is what a measurement system should do.
It should help programmes understand the pathway, not simply report a final number.
The Three Questions Every Indicator Should Answer
Before approving an indicator, ask three questions.
1. What will this tell us?
Be precise.
Do not say:
It measures programme success.
Say:
It tells us the proportion of eligible participants demonstrating the defined behaviour at six-month follow-up.
That language protects against overclaiming.
2. What will this not tell us?
This question is equally important.
For example:
The indicator does not tell us whether the programme caused the observed behaviour.
It does not explain why participants changed.
It does not measure the quality of implementation.
It does not automatically capture sustainability beyond the six-month follow-up period.
Explicit limitations improve interpretation.
They do not weaken the indicator.
3. What will we do with the result?
Imagine the indicator is significantly below target.
What happens?
Investigate?
Adapt?
Conduct qualitative inquiry?
Review implementation quality?
Compare locations?
Now imagine the indicator exceeds the target.
What do you investigate then?
Strong performance can also generate learning.
If nobody can identify a plausible use for the result, question why the indicator exists.
A Practical Indicator Design Workflow
When designing indicators for a new programme, follow this sequence.
Step 1: Clarify the result
Write the change in clear language.
Avoid beginning with measurement terminology.
Step 2: Identify what would be observably different
If the result occurred, what would you actually expect to see?
Different behaviour?
Different service quality?
Different institutional practice?
Different access?
Different conditions?
Step 3: Identify potential measures
Generate several possible indicators before selecting one.
Step 4: Test validity and relevance
Which measure most closely reflects the intended result?
Step 5: Assess feasibility
Can the programme collect it reliably and ethically?
Step 6: Define the measurement
Specify population, numerator, denominator, timeframe, data source and method.
Step 7: Identify disaggregation
Determine which differences matter for programme understanding and equity.
Step 8: Establish baseline and target where appropriate
Document the rationale rather than choosing arbitrary numbers.
Step 9: Identify limitations
What can this measure not tell you?
Step 10: Define management use
Who needs the information and what could they do with it?
Only then should the indicator become part of the approved monitoring framework.
Frequently Asked Questions
What Is the Difference Between an Output and an Outcome Indicator?
An output indicator generally measures what an intervention directly delivers, such as people trained, services provided or facilities constructed.
An outcome indicator measures a change expected to occur as a result of those outputs, such as improved knowledge, changed behaviour, increased access or stronger institutional performance.
Both are useful.
They answer different questions.
Does Every Indicator Need to Be SMART?
SMART remains a useful basic test, but it should not be the only criterion.
An indicator can be SMART and still lack validity, sensitivity, actionability or strong alignment with the intended result.
Use SMART as a starting point, not as proof of indicator quality.
How Many Indicators Should a Programme Have?
There is no universal correct number.
The number should reflect:
programme complexity;
results hierarchy;
donor requirements;
decision needs;
resources;
and data-collection burden.
Every important result should have sufficient evidence, but unnecessary indicators should be avoided.
The goal is not the smallest possible framework.
It is the smallest sufficient framework.
Does Every Indicator Need a Baseline?
Not necessarily.
Some indicators, particularly cumulative outputs for a completely new intervention, may logically begin at zero.
Others require a meaningful pre-intervention reference value.
The important question is whether interpreting change requires knowing the starting condition.
Should Every Indicator Have a Target?
Targets are particularly useful for indicators used to assess planned performance.
Some contextual or exploratory indicators may not require conventional performance targets.
Where targets are used, their rationale should be documented.
Can Qualitative Information Be an Indicator?
Indicators can be quantitative or qualitative, although many monitoring systems rely heavily on quantitative measures.
Qualitative evidence can also complement indicators by explaining mechanisms, experience, context and unexpected results.
Not every important question needs to be converted into a number.
What Is a Proxy Indicator?
A proxy indicator indirectly measures a concept that is difficult to observe directly.
Proxies can be useful when direct measurement is impossible or impractical, but the assumptions connecting the proxy to the underlying concept should be explicit.
Can One Indicator Measure an Entire Outcome?
Sometimes a relatively narrow outcome can be represented adequately by one strong indicator.
More complex outcomes may require several complementary measures.
The objective is not to maximise the number of indicators.
It is to ensure the available evidence represents the important dimensions of the result.
How Often Should Indicators Be Reviewed?
Indicator definitions should be established before routine data collection begins and should remain sufficiently stable for meaningful comparison.
However, review may be justified when:
programme logic changes;
implementation changes materially;
definitions prove ambiguous;
data quality is consistently weak;
the indicator becomes infeasible;
or it no longer provides useful information.
Changes should be documented carefully to preserve interpretability over time.
Final Takeaway
A useful indicator is not simply a number that can be collected.
It is a carefully defined signal that helps an organisation understand something important about its programme.
The strongest indicators are:
connected to a meaningful result;
valid enough to represent what they claim to measure;
defined clearly enough to be measured consistently;
sensitive enough to detect relevant change;
feasible enough to collect well;
disaggregated where meaningful;
interpreted within their limitations;
and
useful enough to influence a decision, question or investigation.
That last point deserves emphasis.
The purpose of an indicator is not to fill a reporting table. It is to reduce uncertainty about something that matters.
Before adding another indicator to a logframe, ask:
What will we understand because this indicator exists?
If the answer is unclear, the indicator probably needs more work.
Mizan Evidence Perspective
Strong indicator frameworks are rarely the ones containing the most indicators.
They are the ones where every important measure has a clear relationship to the programme logic, a credible method, an understood limitation and a reason for being collected.
A good indicator framework should allow programme teams to move from:
What did we do?
to:
What changed?
to:
For whom did it change?
to:
Why might that be happening?
to:
What should we investigate or do next?
That is when indicators stop being reporting requirements and start becoming management tools.
Measure purposefully. Define precisely. Disaggregate thoughtfully. Interpret cautiously. Use the evidence.
Are Your Indicators Helping You Understand Your Programme?
If your programme has indicators that are difficult to define, overly focused on activities, expensive to collect or rarely used for decisions, the solution may not be to add more indicators.
It may be to strengthen the framework you already have.
Assess your MEAL system to identify where programme logic, indicators, data quality and evidence use can be strengthened.
ASSESS YOUR MEAL SYSTEM
Sources & Further Reading
International Fund for Agricultural Development (IFAD)
Theory of Change and Logical Framework Guidance
Practical guidance on results hierarchies, indicators, baselines, targets, means of verification and programme logic.
OECD
Effective Results Frameworks for Sustainable Development
Guidance on designing and using results frameworks, including indicators, baselines, targets and the use of results information.
OECD
Using the SDG Framework in Results Frameworks
Discussion of indicator relevance, usefulness, disaggregation and application within development cooperation results frameworks.
USAID
Performance Indicator Reference Sheet and Performance Monitoring Guidance
An established approach to documenting indicator definitions, purpose, methodology, data sources and other information needed for consistent measurement and interpretation.
UNDP
Handbook on Planning, Monitoring and Evaluating for Development Results
Guidance connecting indicators and monitoring with results-based management, evaluation and organisational learning.